REDWOOD LOGIN
Redwood PortalLTL
SCS
SCS Support
Rockfarm
For February’s truckload update, freight performance slowed slightly due to short-term polar vortex effects and longer-lasting supply chain pain points. Still, demand continues to look promising heading into Q2, but concerns over capacity and driver shortage remain center stage across the industry.
Here’s what we will cover in the truckload update:
February’s shipping volume slowed slightly compared to typical seasonal surges this time of the year due mainly to the polar vortex that took place mid-month.
Looking at Cass’s February Freight Index, volumes rose 1.8% for the month but, when seasonally adjusted, dropped over 3% month over month.


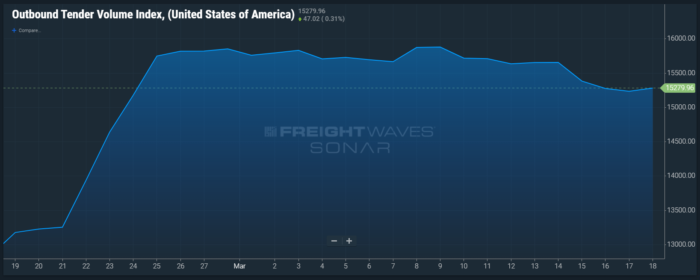
Referencing FreightWave's outbound tender volume index (OTVI), volumes rose 4.9% on average from January to February. Moving from a seasonally high 13,319 average from the previous month, February clocked in at 13,973, just shy of a 5% increase. While lower than anticipated, the gain is still impressive considering the weather constraints impacting shipping mid-month.

Despite the minimal slip in February, freight demand remains positive heading into Q2. Stimulus checks, more vaccinations, and the reopening of businesses to full capacity continue to boost consumer sentiment and spending.
As we turn the corner to spring, look for a rebound in the early part of the next quarter with the rise of produce and food and beverage demand.
Limited capacity continued to plague the market in February. Capturing coverage proved difficult as severe weather bottlenecks disrupted supply chains across the country. Referencing the DAT February load-to-truck (LTT) ratio, LTT was 7.54 to 1, peaking with a prior week reading of 10.89 on 2/28/21.

The tight marketplace caused significant rate increases that are being realized in March. DAT’s spot rate average rose to $2.70 a mile in March compared to February's $2.40, an increase of 12.5% MoM.
All in all, capacity was difficult to uncover and expensive to move. Carriers had pricing power in their hands in ways we hadn't seen in the market since the immediate aftermath of implementing the ELD mandate at the start of January 2018.
Class 8 truck orders rose to 43,800 according to ACT research, representing a 212% increase YOY. This trend marks four straight months with truck orders over 40,000 compared to the rolling 12 month average of just over 25,660 class 8 orders per month.

Carriers are still trying to answer the call to current freight demands, but fulfilling orders remains a challenge as a microchip shortage delays completion as late as 2022. In addition, the ability to seat drivers in these trucks remains a major obstacle like most things these days due to Covid.
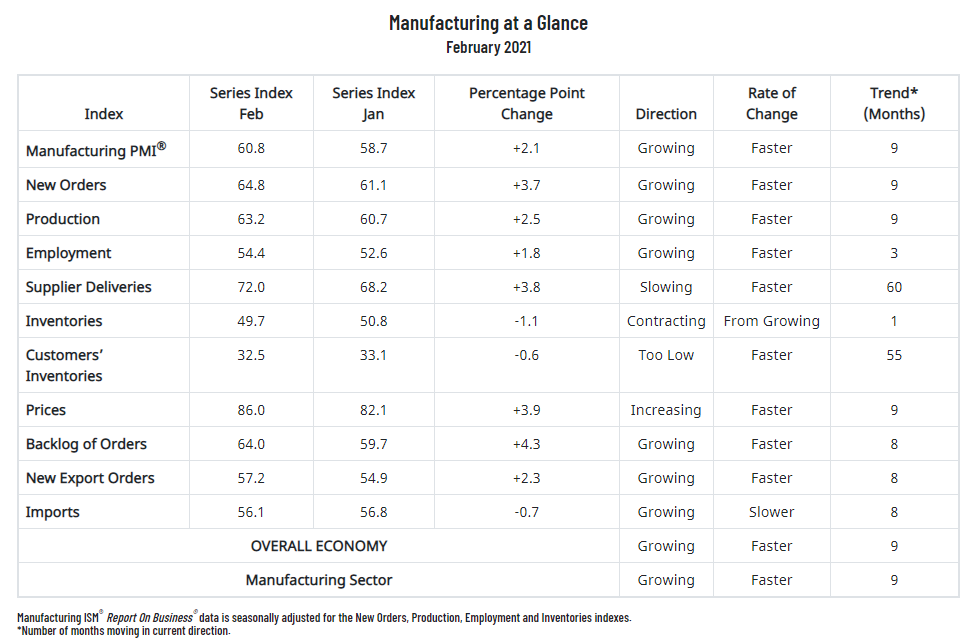
Manufacturing continued its recovery in February with a PMI reading of 60.8% (+2.1 points from January and the highest reading since February 2018). Most notably, a new Order reading of 64.8% alongside a customer inventory reading of 32.5% (tied for the lowest reading in 24 years), indicating continued near-term needs.

According to Timothy Fiore, Chair of the Institute for Supply Management, “The manufacturing economy continued its recovery in February. Survey Committee members reported that their companies and suppliers continue to operate in reconfigured factories. Issues with absenteeism, short-term shutdowns to sanitize facilities, and difficulties in hiring workers remain challenges and continue to cause strains that limit manufacturing-growth potential. Optimistic panel sentiment increased, with five positive comments for every cautious comment, compared to a 3-to-1 ratio in January...of the six biggest manufacturing industries, five — Chemical Products; Fabricated Metal Products; Transportation Equipment; Computer & Electronic Products; and Food, Beverage & Tobacco Products — registered strong growth in February. Petroleum & Coal Products moderately contracted.”
Looking forward, here are a few notable trends and seasonal events to pay attention to:
Do you need a freight quote or have a managed transportation need? Contact us here.